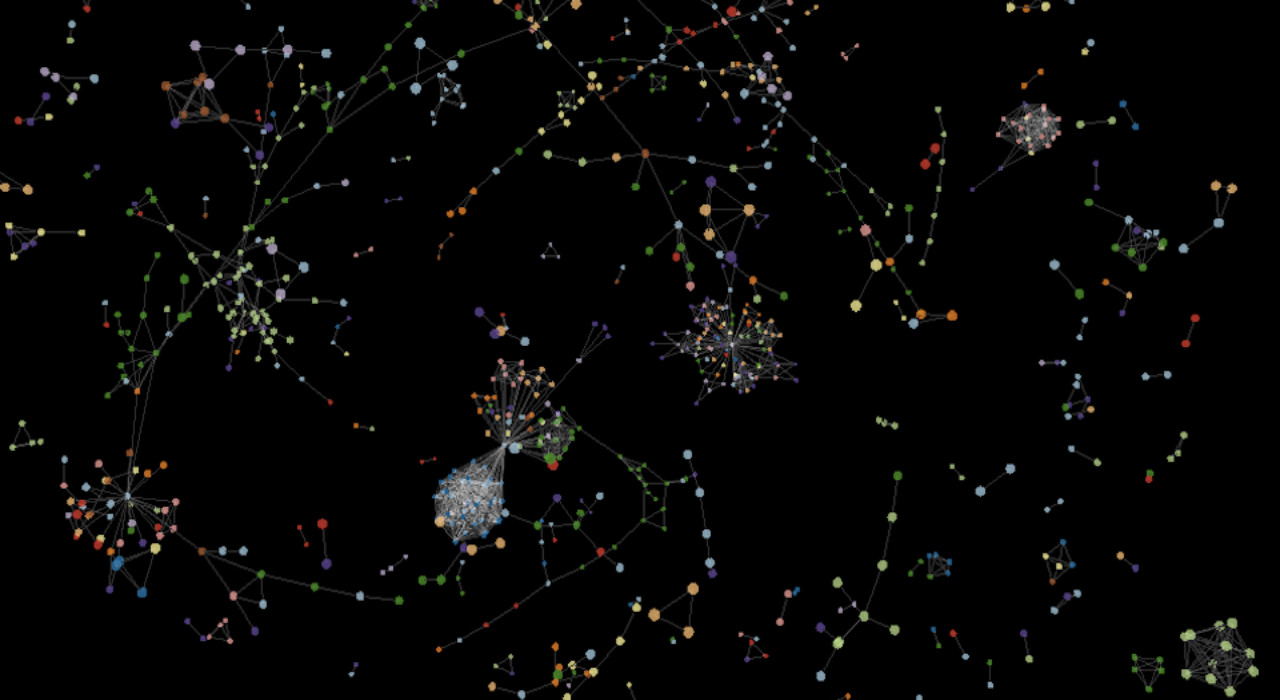
Graph visualization

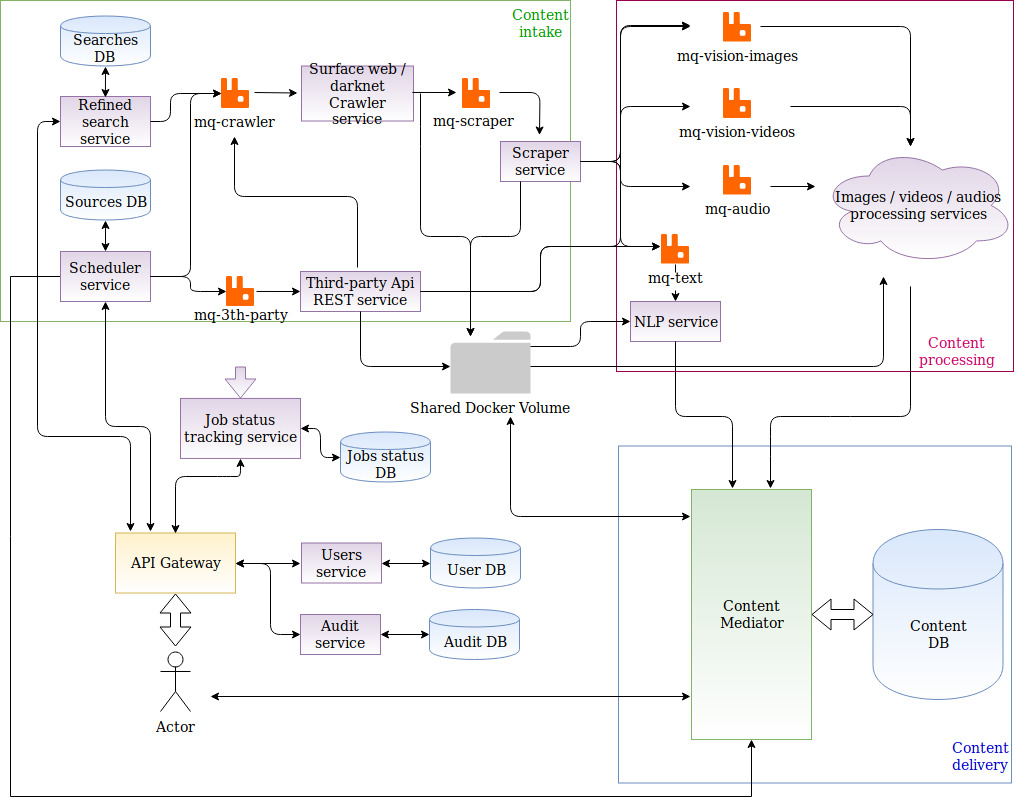
SPIRIT UI retrieves all data from the SPIRIT services and allows to develop interactive visualisation to see relationships and connections within their data set significantly faster. This visualization is achieved by using nodes and edges. A node represents a single data point, such as a person, a location, while an edge represents a connection between two nodes, such as a communication.


